I want to be able to plot the vertex entered by the student.
This hasn’t worked:
vertex_string = table1.cellContent(1,1) ##I have also tried (1,2), (2,1), (2,2) in case I’m referencing the wrong
cell number
point = parseOrderedPair(vertex_string)
First of all, the code looks great, everything is mostly where is should be! There are a couple of things that could be going wrong, small stuff that could be the difference:
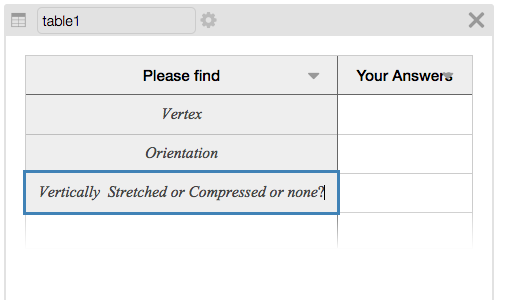
Tables are referenced as (row,column) so your empty cells now are (1,2) (2,2) and (3,2).
After you’ve created numeric values for x_1 and y_1 you need to tell the calculator to plot them as a coordinate point. Go into the calculator and type in (x_1,y_1)
Hi Jay! I am trying to copy the code from this post and am failing miserably! I am creating an exploration for standard and factored forms of a quadratic and how each form reveals an intercept…so I want the points for the intercept to populate to the graph when the students writes them in the table so that it is naturally checking. However, I can’t get the ordered pairs to populate to the graph. I appreciate any help you can offer!
OR…see the attached screenshot. Is there anyway that after a student select the intercepts on the graph they can stay up even when the student is writing in another component on the screen?