I just want to have the points connect (not best fit line). What would I need to add to the graph or the code I have here?
numberList(“X”): table1.columnNumericValues(1)
numberList(“Y”): table1.columnNumericValues(2)
Thank you!
I just want to have the points connect (not best fit line). What would I need to add to the graph or the code I have here?
numberList(“X”): table1.columnNumericValues(1)
numberList(“Y”): table1.columnNumericValues(2)
Thank you!
Make lists X and Y in your graph. Add a couple elements, it doesn’t matter. Then, (X,Y) and in the point menu, toggle lines (the blue icon in the pic). Since X and Y are being set in the CL, you won’t see your preset lists display initially, but you can delete them after setting the point colors and lines.

If you want a closed polygon, you could use:
polygon((X,Y))
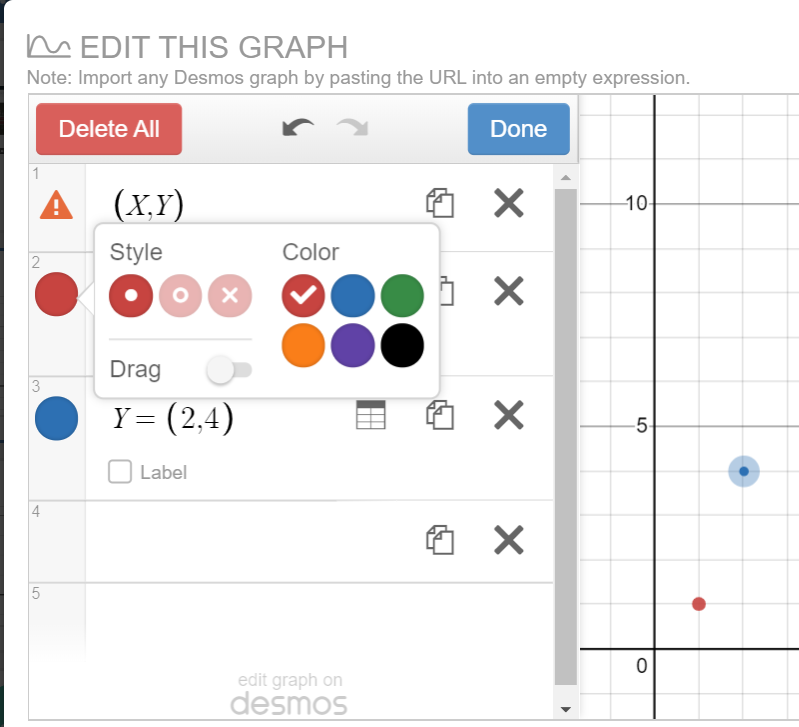
Thank you so much for your reply! For some reason I’m not seeing the line option, just color, point style, and drag… any thoughts on why that might be?image|549x500
You have parentheses for X and Y instead of brackets. The line option is in (X,Y) once your warning disappears.
Thanks again! That did it! 