I’m sorry if the title is long, I just really don’t know how to describe it better.
The main thing I’m trying to do, it to create a “visual in between” curve, thanks to 2 other curves/functions.
((x0,y0) is the center of the circle.)
I would like to, depending on a parameter x0 (coordinate), make desmos find the coordinate y0 (between f(x0) and g(x0)) that maximizes the radius of the circle that perfectly fits between the 2 curves, or if you prefer, find the y0 coordinate such that the circle can touch the 2 curves simultaneously.
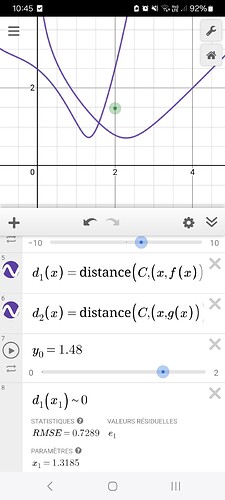
What I did, is for each coordinate x0 and y0, I made the functions d1 and d2, that are the distance function, between the center of the circle (x0,y0) and all points (x,f(x)) and (x,g(x)) (the 2 mother curves/functions). Then, I used the “d1(x1)~0” in order to find the minimum of the curve d1, basically finding the closest point of the curve f to the center of the circle, and same for the curve g.
The thing is, I need desmos to automatically find the y0, that ensures the min of d1 and d2 are the same, and idk how to. And even if I manage to do it, I would like to make desmos graph the parametric curve in between at the end. Because I have another issue, that I’m sure will happen, is that I managed to do something similar on another graph, but desmos can only plot the point of the resulting curve depending on the parameter x0. I tried changing everything with t to do a parametric curve, but it doesn’t work.
So yeah I’m stuck on that current problem, and I’m sure that other problem will arise.
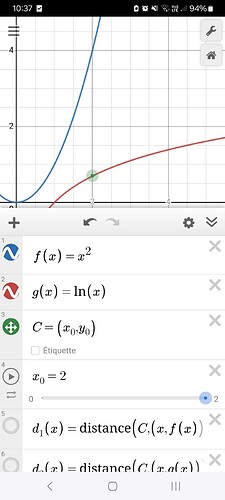
Here, examples with f(x)=x², g(x)=ln(x), and x0=2. I showed the “make the circle the biggest/touch the 2 curves” and “make the min of d1 and d2 the same”. Here, the correct value is y0=1.48. So the goal is to make desmos to the graph H(x)=y0, for each value x=x0.


