I want students to input 3 numerical values on one screen. I want CL to make a histogram of all the data for all the students and then I want the mean of everything.
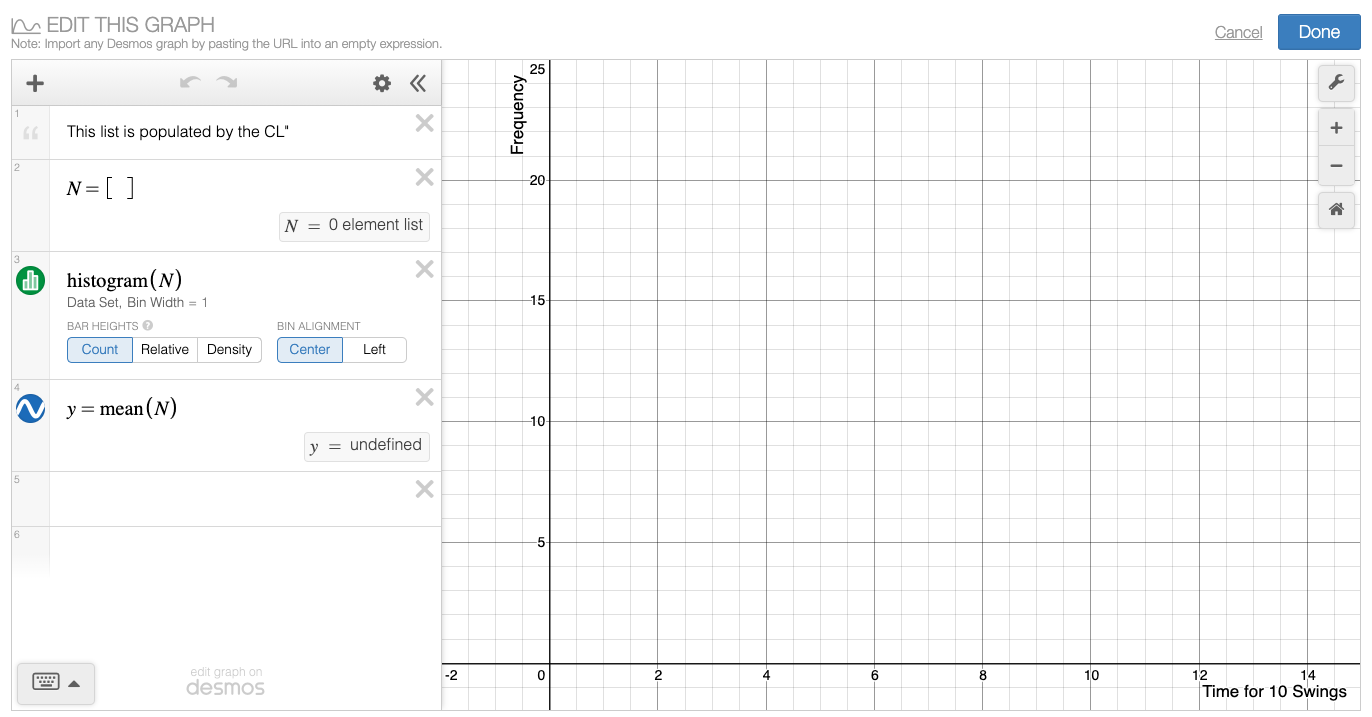
I have figured out how to make a histogram out of 1 set of inputs (by creating a list called N). Is there a way to merge all three of my inputs into one big list and one big histogram?
And I know how to get the mean of 1 list and have it displayed as a horizontal line on a graph using y=mean(N) but I also want it to display the numerical value.
Removing my comment because of a better solution.
See cwinske’s post below.
I saw that and was very overwhelmed by it! I also saw another solution that was posted along with the one you shared but I am not able to get it to work for me. I am very new to all this. I appreciate your help. I will look into what you sent a little more and see if I can figure it out.
The concatenation of lists from that link could now be replaced by using the join function. Is this what you’re looking for?
Yes! This is amazing! So simple and it works perfectly. Thank you so much. I searched for a long time today and didn’t see any mention of a “join” function but as a newbie, maybe I just didn’t even know what exactly to be looking for. Thank you SO much!
Ha! I keep forgetting about new features.
No worries! I really appreciate you taking time to try to help me. Take care!