Hi Desmos Experts,
I have an activity that allows the students 600 seconds (10 minutes) to complete it after doing the example question, see https://teacher.desmos.com/activitybuilder/custom/61dafca0d6756772917863bb
The teachers dashboard is supposed to display the score and how long the students have left
number(`t_{imeLeft}`): Timer.script.timeLeft
The score is displaying just fine, but as soon as the students start the questions the dashboard fails to show the time left.
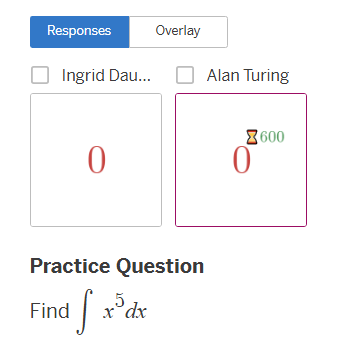
In the screenshot below, Ingrid has completed the example question, but Alan hasn’t. Alan’s dashboard displays the time left (600 secs), but Ingrid’s time has gone to zero, even though she has time left.
Your timer icon is set to only display if t_imeLeft > 0. Maybe set to >= 0 instead? Or not restrict it at all, but only display values between 0 and 600… median(0, t_imeLeft, 600)
I’m a little wary to assist this one given a number of studies linking timed assessment with decreased performance particularly in students who already have higher math anxiety.
Thanks for your quick response.
Here’s the super weird thing. If I don’t restrict the timer at all, then the behaviour is exactly the same.
Thanks for sharing your concern about Maths anxiety, it’s a really important point to raise. In this specific case the timed element is low stakes and designed to test fluency.
@David_BUSH I played around with this quite a bit. I tried varying text sizes, string vs. latex point labels, using the calculator expression label vs. CL pointLabel and lots of other ideas. Ultimately I believe that the teacher view will display the final/end limit defined for any graph label tied to timeSincePress. I’m not sure WHY that it is, but it seems to be that way. As soon as the button is pressed your teacher view is showing 0 because that is the ‘end’ value defined for the timeSincePress. I created another point and label tied directly to a timeSincePress(500) and as soon as the button is pressed the teacher view shows that point labeled as 500 - even though it definitely hasn’t been that long and does not appear that way for the student.
Sorry this doesn’t help you more with what you were trying to do, but maybe it helps identify the exact nature of the ‘bug’ you are running into and the way you will need to think around it…?
Thanks for all your hard work Scott, really appreciated. It’s given me an idea for how to fix the issue
My plan is to swap the timeSincePress source from the action button to a ticker on the graph. I’ll implement it and report back here.
Related to this, I think too that the dashboard thumbnails simply can’t keep up with all student work in real-time. You should be able to see for each individual student view, but I don’t think you’ll get exactly what you’re looking for.
Is there some specific way you’re intending to use the displayed time? I’m wondering if there might be an alternative.
The idea with the teacher dashboard is two fold. The score enables me to see which students need help and the timer lets me know when all the students are finished since with the vagaries of our school WiFi it can be several minutes difference in start time. You’ve prompted me to think of a nice extension to add for those that finish early.
I was going to say something similar to what @Daniel_Grubbs just commented, in that I’m not sure how frequently the teacher-view thumbnails update. They definitely won’t display the remaining timer in real time (there would be some delay and the counter would remain static until the next ‘snapshot’ is taken), which perhaps is why it was behaving the way it was with the timeSincePress. It will be interesting to see if it does the same thing when you use a ticker.
Another possibility would be to change the background color of the graph (or other graph component) depending upon how much time remains (green if t>400, blue if 200<=t<400, etc).
At least for this, you shouldn’t need any exact time. So I’d consider some sort of binary feedback, like the background color that @Scott_Walker suggests. I do, too, like defining a range as he suggests which will require a little less precision in the thumbnail.
I’m created a simplified activity using the ticker to show the time.
Here’s the results
The Teacher’s Dashboard shows both students with an elapsed time of 18
So the behaviour on the teacher dashboard using ticker is different from when the activity was using timeSincePress but still inconsistent with what is shown on the student view
Bit disappointed as I thought ticker was going to be the solution
Back to the drawing board.